Policy & markets · Global
The Duck Curve and Curtailment: Solar's Success Problem
Adding solar reshapes demand into a curve that dips at midday and ramps steeply at sunset. Here is why that causes curtailment and negative prices — and what fixes it.
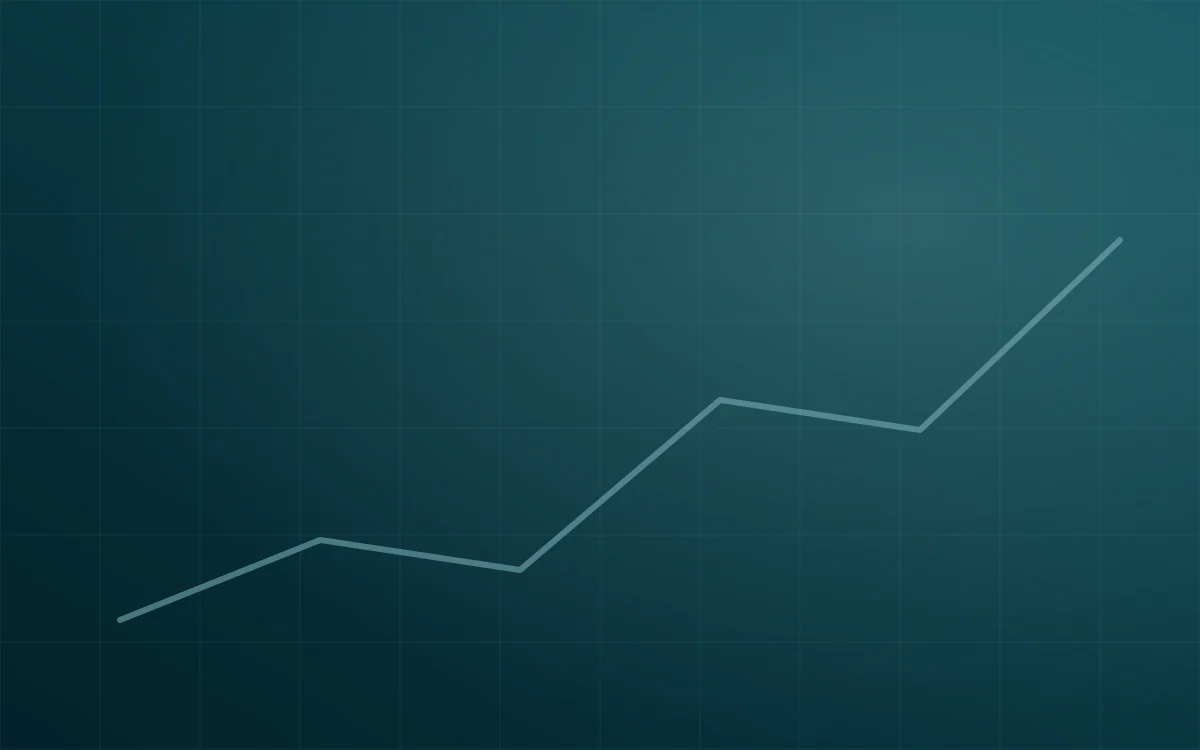
The duck curve is the clearest illustration of a counterintuitive truth: the difficulty with solar is not producing enough electricity. It is producing it at the same time as everyone else.
What the curve shows
Plot electricity demand across a day and you get a familiar shape — low overnight, rising through the morning, peaking in the evening.
Now subtract solar generation. What remains is net load: the demand that must be served by everything other than solar.
At low solar penetration, net load looks much like gross demand. As solar grows, midday net load collapses. Evening demand does not, because solar output falls to zero as demand peaks.
The result is a deep midday trough followed by a steep evening rise — a silhouette resembling a duck. The name stuck because the shape is unmistakable.
The two problems it creates
The midday trough. Net load becomes very low. Conventional plant must reduce output dramatically, and some plants cannot go below a minimum stable level without shutting down entirely. When generation exceeds what the system can absorb, something must give.
The evening ramp. This is the harder problem, and it receives less attention. As solar output falls at sunset while demand climbs, net load rises very rapidly. The system must increase non-solar output by a large amount in a short time.
That requires plant capable of ramping fast — which is not the same as plant capable of generating cheaply. A system can have ample capacity and still struggle if it cannot ramp quickly enough.
Curtailment
When there is more generation than the system can use, output must be reduced. That is curtailment.
It feels wasteful because it is — free sunshine deliberately discarded. But it is often the rational outcome. The alternatives are shutting down inflexible plant that cannot restart quickly, or building storage and transmission that may cost more than the energy saved.
Some curtailment is economically optimal. Building infrastructure to capture every last megawatt-hour of an occasional surplus is rarely worth it.
The problem is that curtailment rises non-linearly with penetration. Doubling solar capacity can more than double curtailed energy, which steadily erodes the value of each additional plant. That dynamic is what pushes markets toward storage procurement, as described in battery storage in the Middle East.
Curtailment also has a contractual dimension that matters enormously in some markets. Where contracts require payment for energy that could have been delivered, curtailment costs the system money without delivering electricity — the situation in Pakistan's wind corridor.
Negative prices
In markets with wholesale trading, abundant midday generation can drive prices below zero — generators paying to keep producing.
This seems irrational until you consider the alternatives. A plant may face high costs to shut down and restart. A generator receiving a subsidy per megawatt-hour may still profit at a modestly negative price. Either way, staying on can be the rational choice.
Negative prices are a signal, not a malfunction: the system has more electricity than it can use at that moment, and it is worth less than nothing.
What actually fixes it
Storage. The most direct answer — absorb the midday surplus, discharge into the evening ramp. It flattens the trough and reduces the ramp simultaneously. Four-hour batteries became the default precisely because that duration matches the shape of the problem.
Demand shifting. Moving consumption into the midday surplus. Industrial processes, water pumping, electric vehicle charging, ice-making for district cooling and desalination are all candidates. This is frequently cheaper than storage, because it uses the electricity rather than storing it.
Flexible generation. Plant that can ramp quickly and operate at low minimum levels. Less efficient than baseload, but flexibility becomes more valuable than efficiency in a high-renewable system.
Interconnection. Neighbouring systems with different demand shapes or time zones can absorb surplus and supply during ramps — part of the argument for regional trade discussed in Himalayan hydropower.
Complementary generation. Wind frequently generates when solar does not, reducing the depth of the trough and the height of the ramp.
Panel orientation. Facing some arrays west rather than south shifts generation later in the day. It reduces total annual output but produces electricity when it is worth more — the same value logic behind solar trackers.
Time-of-use tariffs. Prices that reflect actual system conditions, encouraging consumption when electricity is abundant and discouraging it during the evening peak. Cheap to implement and frequently politically difficult.
Why this matters for our regions
Gulf and South Asian systems have a particular version of the problem: cooling demand peaks in the evening and persists through the night.
That makes the evening ramp steeper and longer than in temperate systems. It also makes the solution clearer, because cooling is a flexible load. Ice made at midday provides cooling in the evening — energy storage that costs far less than batteries when the end use is thermal.
The regions adding solar fastest will encounter the duck curve soonest. Several already have.
The bottom line
The duck curve is what success looks like when it arrives faster than flexibility. The problem is not too much solar; it is too little of everything that makes solar usable across the whole day. Storage, flexible demand and tariffs that reflect real conditions are the answer — and the systems that build them alongside generation avoid discovering the curve the expensive way.
Follow the integration challenge, not just the capacity
The next phase of the energy transition is about using renewable electricity, not generating it.
- Read the policy and markets desk for grid integration and market design analysis.
- Explore the battery storage desk for the technologies addressing it.
- Subscribe to The Energy Edit — independent reporting on Middle East and South Asian energy, free and no paywall. Start here.
Working on grid flexibility, storage or demand response? Explore partnership with Arcnex Energy or contact our team.
ANSWERS
Questions answered in this story
What is the duck curve?
A chart of electricity demand minus solar generation across a day. As solar grows, midday net demand falls sharply while evening demand remains high, producing a shape resembling a duck's silhouette.
Why does solar cause curtailment?
Because at high penetration, midday generation can exceed what the grid can absorb given inflexible baseload plant and limited storage. Output must then be reduced even though the resource is available.
What are negative electricity prices?
Prices below zero, occurring when there is more generation than demand and some generators prefer to pay to keep running rather than shut down and restart.
How is the duck curve addressed?
Through storage shifting midday surplus into the evening, demand response, flexible generation, interconnection with neighbouring systems, and time-of-use tariffs encouraging daytime consumption.